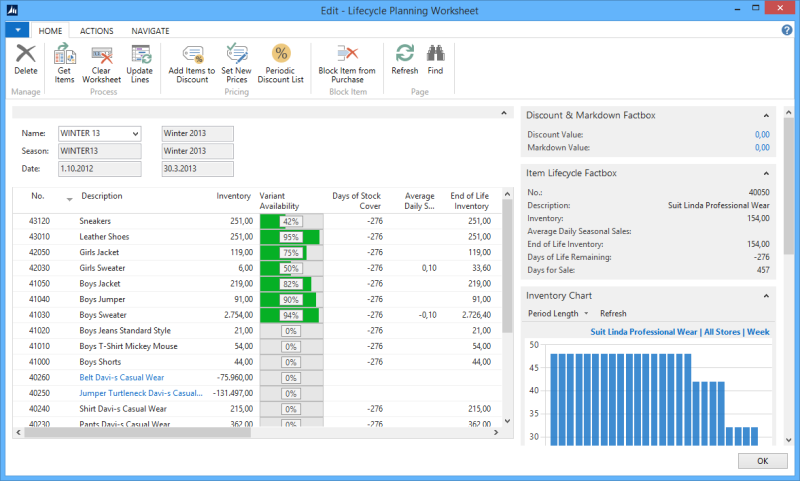
This topic describes the Lifecycle Planning Worksheet.
The user filters on a worksheet and possibly on a store. On the right-hand side of the worksheet there are some FactBoxes and value charts with information related to the worksheet lines.
Discount & Markdown FactBox
If the user chooses to add an item to a discount offer by entering a value in the field New Discount %, the Discount Value in the Discount & Markdown FactBox displays the total value of such discounts before the discount lines are created. If the user changes the item’s price by entering a value in the New Price field, the Markdown Value in the FactBox displays the total value of the price changes suggested in the worksheet before the new sales price lines are created.
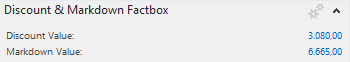
After adding the items to a discount offer, the New Discount % values are set to zero, hence the Discount Value in the FactBox is also set to zero. After adding a new sales price to an item the Markdown Value is set to zero. These values are explained later in this document in the SettingNew Discount % and Setting New Price chapters.
Item Lifecycle FactBox
The Item Lifecycle FactBox shows information on the item in the selected line.
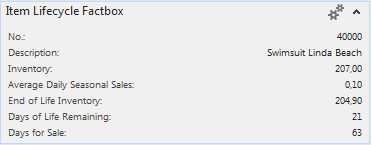
The Days of Life Remaining represents the number of days left of the season associated to the worksheet selected. Days for Sale displays the number of days within the season period that the item has been on sale. Other fields in this FactBox are the same as in the worksheet lines and are discussed later in the document.
Charts
The Inventory, and Item Sales Charts display, for the selected item line in the worksheet, the item’s inventory and sales quantities over a period of time starting either with
- The item’s Lifecycle Starting Date if selected on the
- The selected Season’s Starting Date if selected and the property in case 1 is not set.
- The beginning of 12 weeks from TODAY if the properties in case 1 and 2 are not set.
In the Inventory Chart the inventory values are calculated over the time period from the beginning as described and up to today.
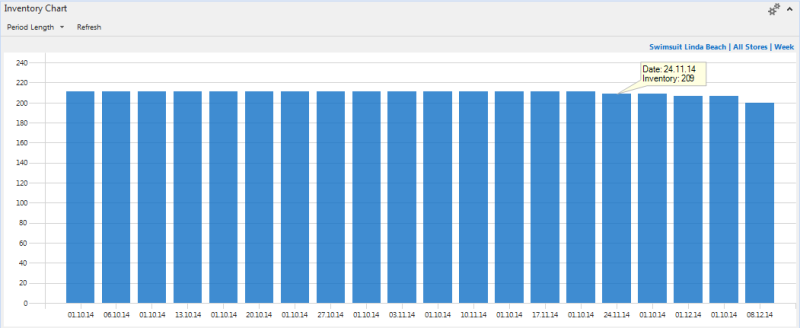
The item sales that have not been included in a posted statement are not included in the chart quantities.
There are three options for the Period Length; Day, Week and Month. The default value for the chart is Week. The chart columns represent the inventory value over the selected period. The x-axis value represents the beginning of the period. That is, as shown on the image, the period selected is Week, then the column for 24.11.14 represents the cumulative change in inventory over the week 24.11.14 to 30.11.14.
Note also that on the image, the first column does not represent a whole week. This is because the season in consideration does not start on a Monday. It starts on Wednesday 01.10.14, hence the first column represents the week part from the beginning of the season until the beginning of the first whole week of the season.
Pressing Refresh on the chart results in displaying the values with regard to the default Period LengthWeek.
In the Item Sales Chart the sales quantities are calculated over the same time period as displayed in the Inventory Chart.
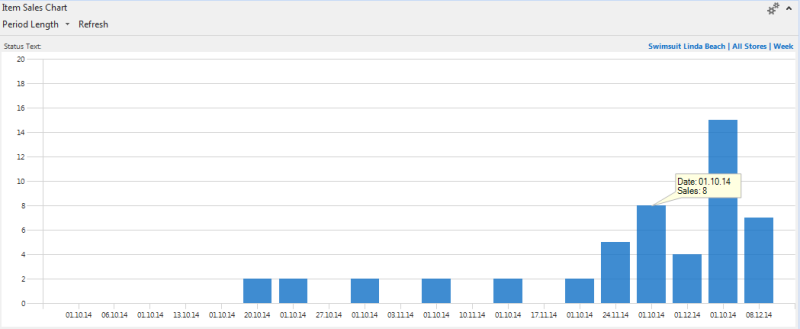
The sales values include sales that are included in statements that have not been posted. All chart properties are the same for the Item Sales Chart and the Inventory Chart. That is the functions for Period Length and Reset work the same. Week is the default Period Length value, and the first column does not necessarily represent a whole week.
Selecting a Worksheet Template
To begin with, the user needs to select a worksheet to work with via the Name lookup.
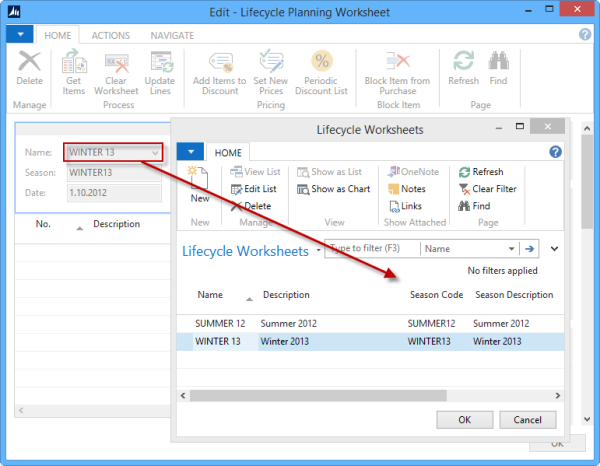
On lookup the LifecycleWorksheets page opens.
If there is only one worksheet available it is loaded upon opening the page. Each worksheet needs to have a season assigned to it. All totals in the Lifecycle Planning Worksheet are calculated with regard to the Starting and Ending Date of the associated season. Worksheets are also created and modified via the Lifecycle Planning page.
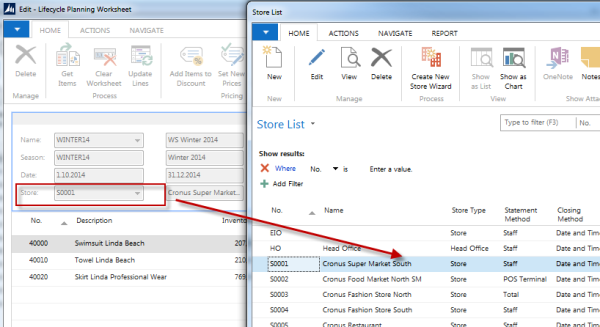
Filtering on a Store
If the user has a store assigned, in Retail Users, the store filtering is done with regard to that store and the Store lookup is hidden on the Lifecycle Planning Worksheet.
If the user does not have an assigned store in Retail Users, the user can filter on Store via the Store lookup. All calculations are then done with regard to the selected store filtering.
Populating the Worksheet
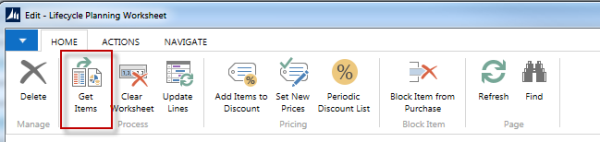
Under the action group Process there are actions that relate to populating the worksheet.
The action Get Items populates the Lifecycle Planning Worksheet with items that belong to the season associated with the selected worksheet.
On executing the action a filtering dialog is displayed:
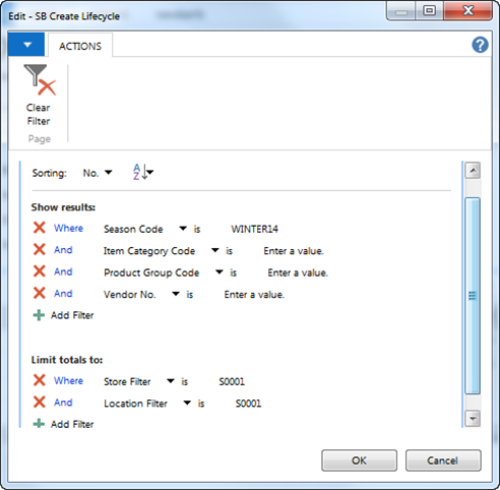
In the dialog, the filtering on Season Code has been selected, there is also filtering on Store and Location if a store has been selected in the worksheet. If the user does not enter a filtering, a line in the worksheet is created for each item that has the selected Season Code. If the user enters some other filters, the lines generated in the worksheet will reflect that.
If an item is added to the season later on, the action Get Items will update previous lines and create a line for the new item.
The user can delete all lines in the worksheet by pressing the action Clear Worksheet:
![]()
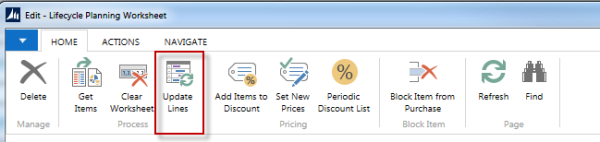
To update the worksheet lines, the user can execute the action Update Lines. The action updates all fields in the worksheet lines, and the FactBox values are updated as well.
See Also